
New Paper: Metrics For Graph Comparison
I just put a new paper up on the arXiv, and so I thought I would share it here. This was the final paper I wrote for my Ph.D., and it’s the one I’m most proud of. The paper is called “Metrics for Graph Comparison: a Practitioner’s Guide.”
The Basic Idea
Suppose you have two graphs, or even just a single graph that is changing in time. For example, you might have a social network between students at a school that evolves as time passes. Below, we see the social network for a particular French elementary school, which is evolving as the day passes. Each vertex is a person, and each edge indicates face-to-face contact.
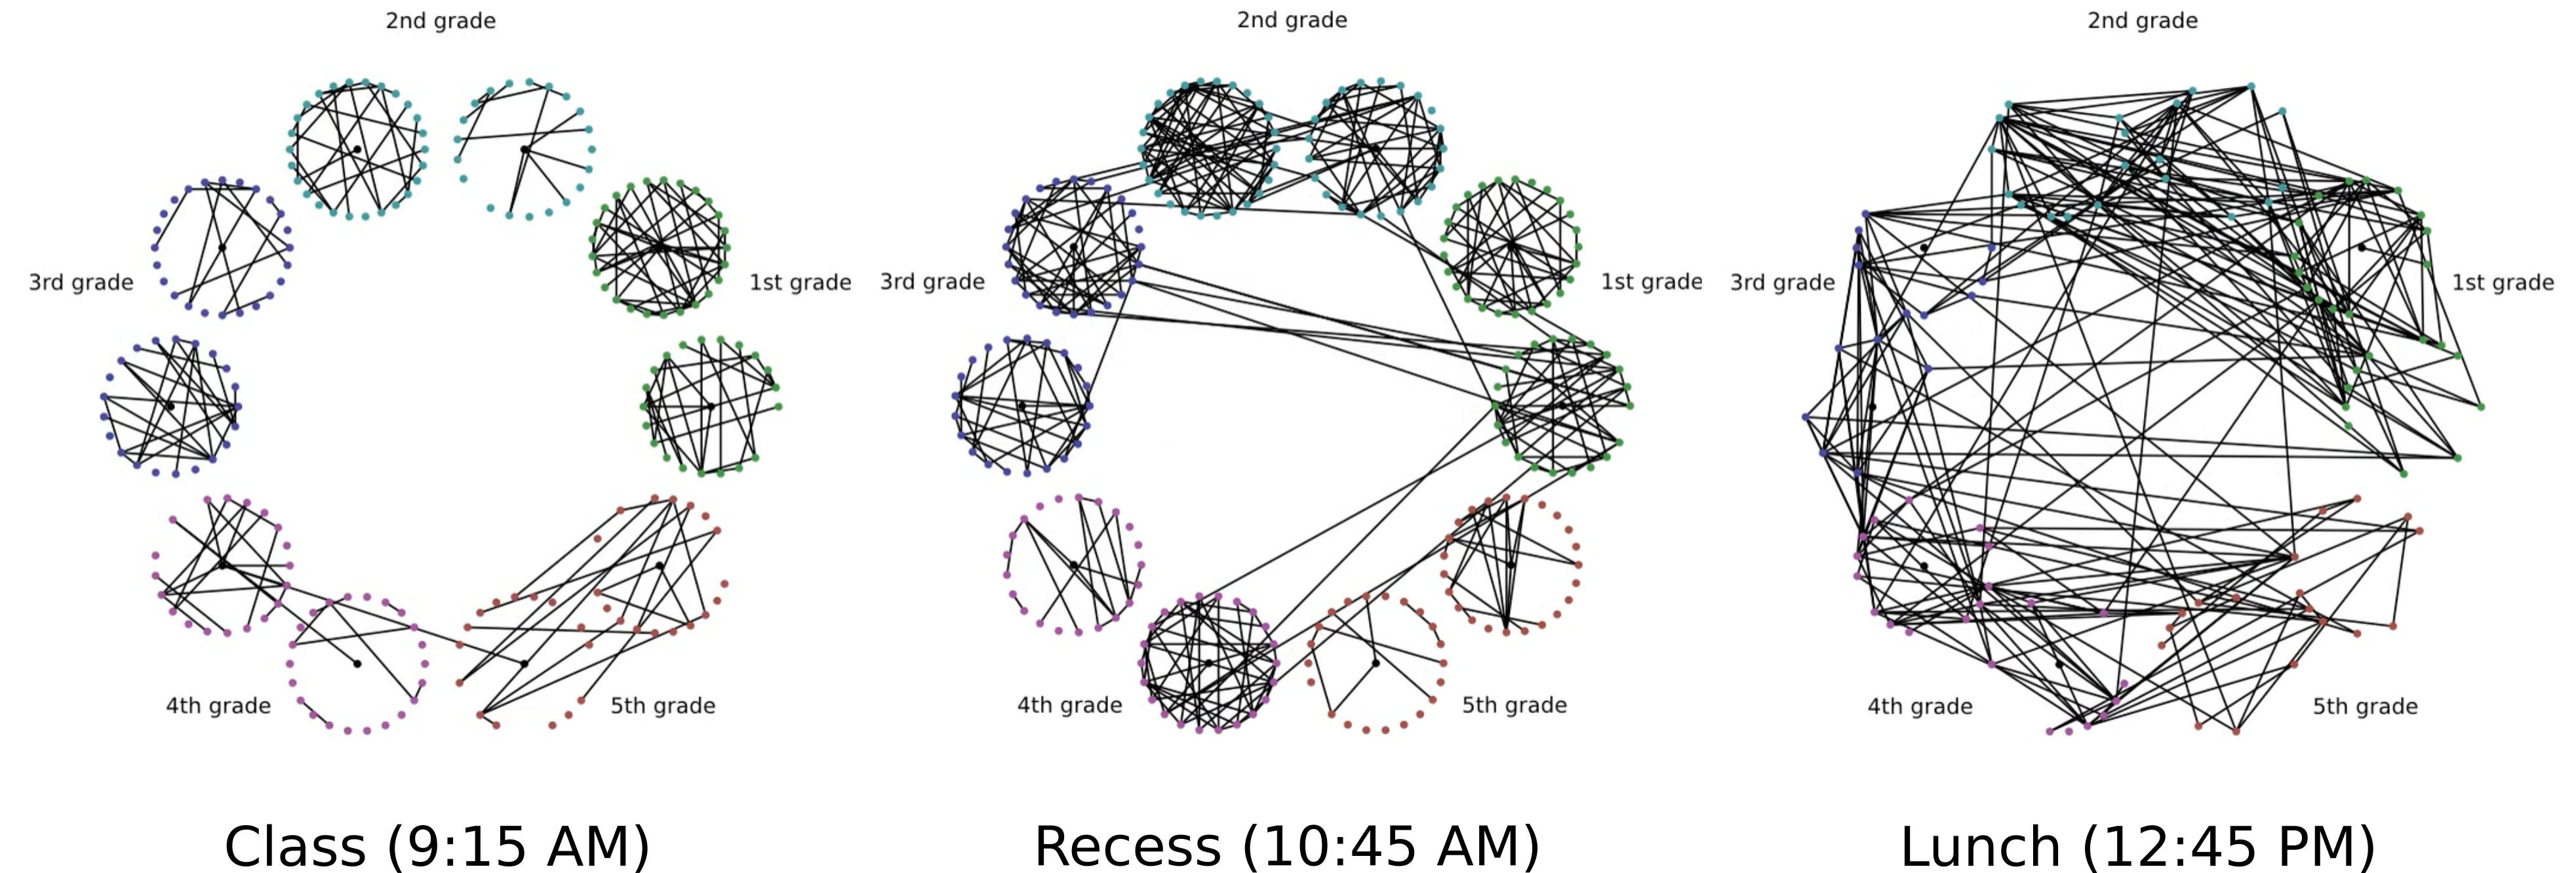
One important question that we must answer is “how much did the graph change between times \(t\) and \(t+1\)?” Said another way, how similar are graphs \(G_t\) and \(G_{t+1}\)? The central subjects of this paper are the many methods available for comparing graphs.
We study these methods both by looking at empirical examples like the one above, as well as by doing a large study of the statistics of comparing various random graph models. Which graph comparison tool can best distinguish an Erdos-Renyi random graph from a stochastic blockmodel? What about comparing a random graph with fixed degree distribution to a preferential attachment graph? Using Monte Carlo simulation of the graphs, we are able to answer these questions and gain insight into the behavior of our distances when they are used on a variety of different structures and geometries.
One important focus of the paper is on practicality, and so we only look at distances that are linear or near-linear (i.e. \(O(n)\) or \(O(n \log n)\)) in the number of vertices in the graph.1 More computationally expensive distances may be of theoretical interest, but for the graphs used in business, which often range upwards of 1 million vertices, they are not feasible to use.
Findings
There is a lot of nuance in the interpretation of these comparisons - it’s not as simplea as “method X is the best”. The results depend strongly on the geometric structural differences you with to learn about the graph. Do you care about total connectivity? Then just use a simple edit distance. If you care about the community structure of a graph, then you should probably use a spectral distance.
That said, we find that spectral methods (which are quite standard, and have been around for some time) are strong performers all around. They are robust, flexible, and have the added benefit of easy implementation - fast spectral algorithms are ubiquitous in modern computing packages such a MATLAB, SciPy, and Julia.
For example, here is a plot showing how well the different distances are able to discern an Erdos-Renyi random graph from a stochastic blockmodel.
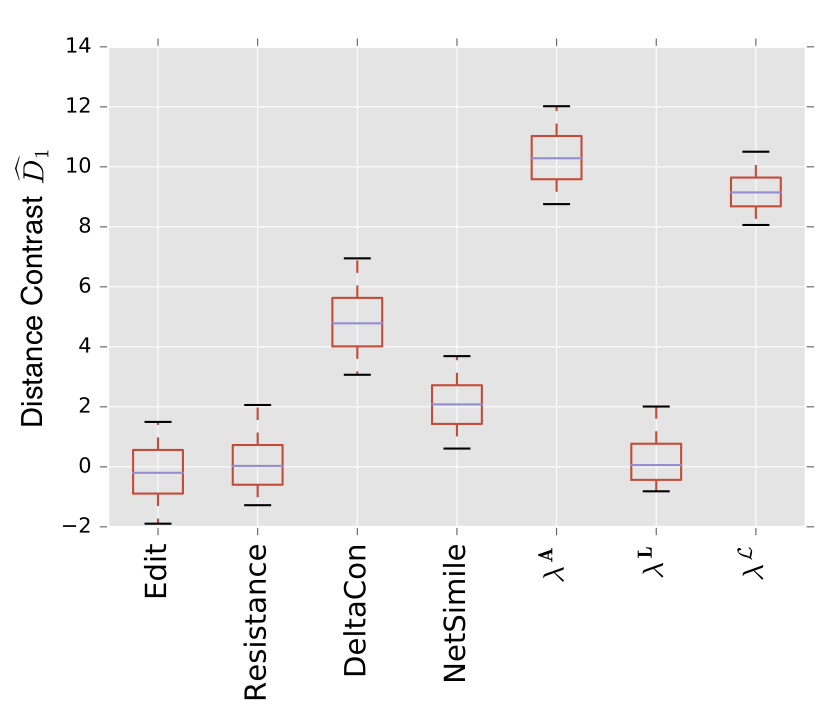
Higher numbers mean that the distances can more reliably discern between the two populations. We see that the adjacency spectral distance \(\lambda^A\) and the normalized Laplacian spectral distance \(\lambda^{\mathcal L}\) are most reliably able to pick out the community structure that differentiates between these two models. This is not surprising, as the spectra of the graph has a direct interpretation in terms of vibrational modes, which depend critically upon community structure.
If you want to know more, check out the full paper. The above result is just one of a large collection of findings that we lay out. As I said before, the idea isn’t to come to a single conclusion; it is to survey the landscape and to compare and contrast these different tools.
Conclusion
In research, so many people spend so much time developing new methods, and I always think to myself, “How does this compare to the standard method? Is it actually an improvement?” This paper attempts to take stock of a number of standard and cutting-edge methods in graph comparison, and see what works best. After spending some time doing a theoretical analysis of a particular graph distance metric (see my previous paper) I was curious to see how all the tools available compared to one another.
Also, I’ve implemented many of these distances in my Python library NetComp, which
you can get via pip install netcomp. Check it out, and feel free to post issues and/or
PRs if you want to add to/modify the library.
Let me know in the comments what you think! Or feel free to email me if you have more detailed questions about graph metrics. Happy Friday!
-
This is paired with the assumption that the graph is sparse, so the number of edges is \(O(n \log n)\) ↩
Comments