Anomaly Detection in Social Networks
(Code for this project is available on GitHub.)
This project looks at ways to automatically detect important changes in social networks. We use a dataset collected in a French primary school; RFID tags were used to map face-to-face contact bewtween students. This give us a social network that changes over minutes, rather than the weeks or years it takes to see significant change in online social networks.
The Data
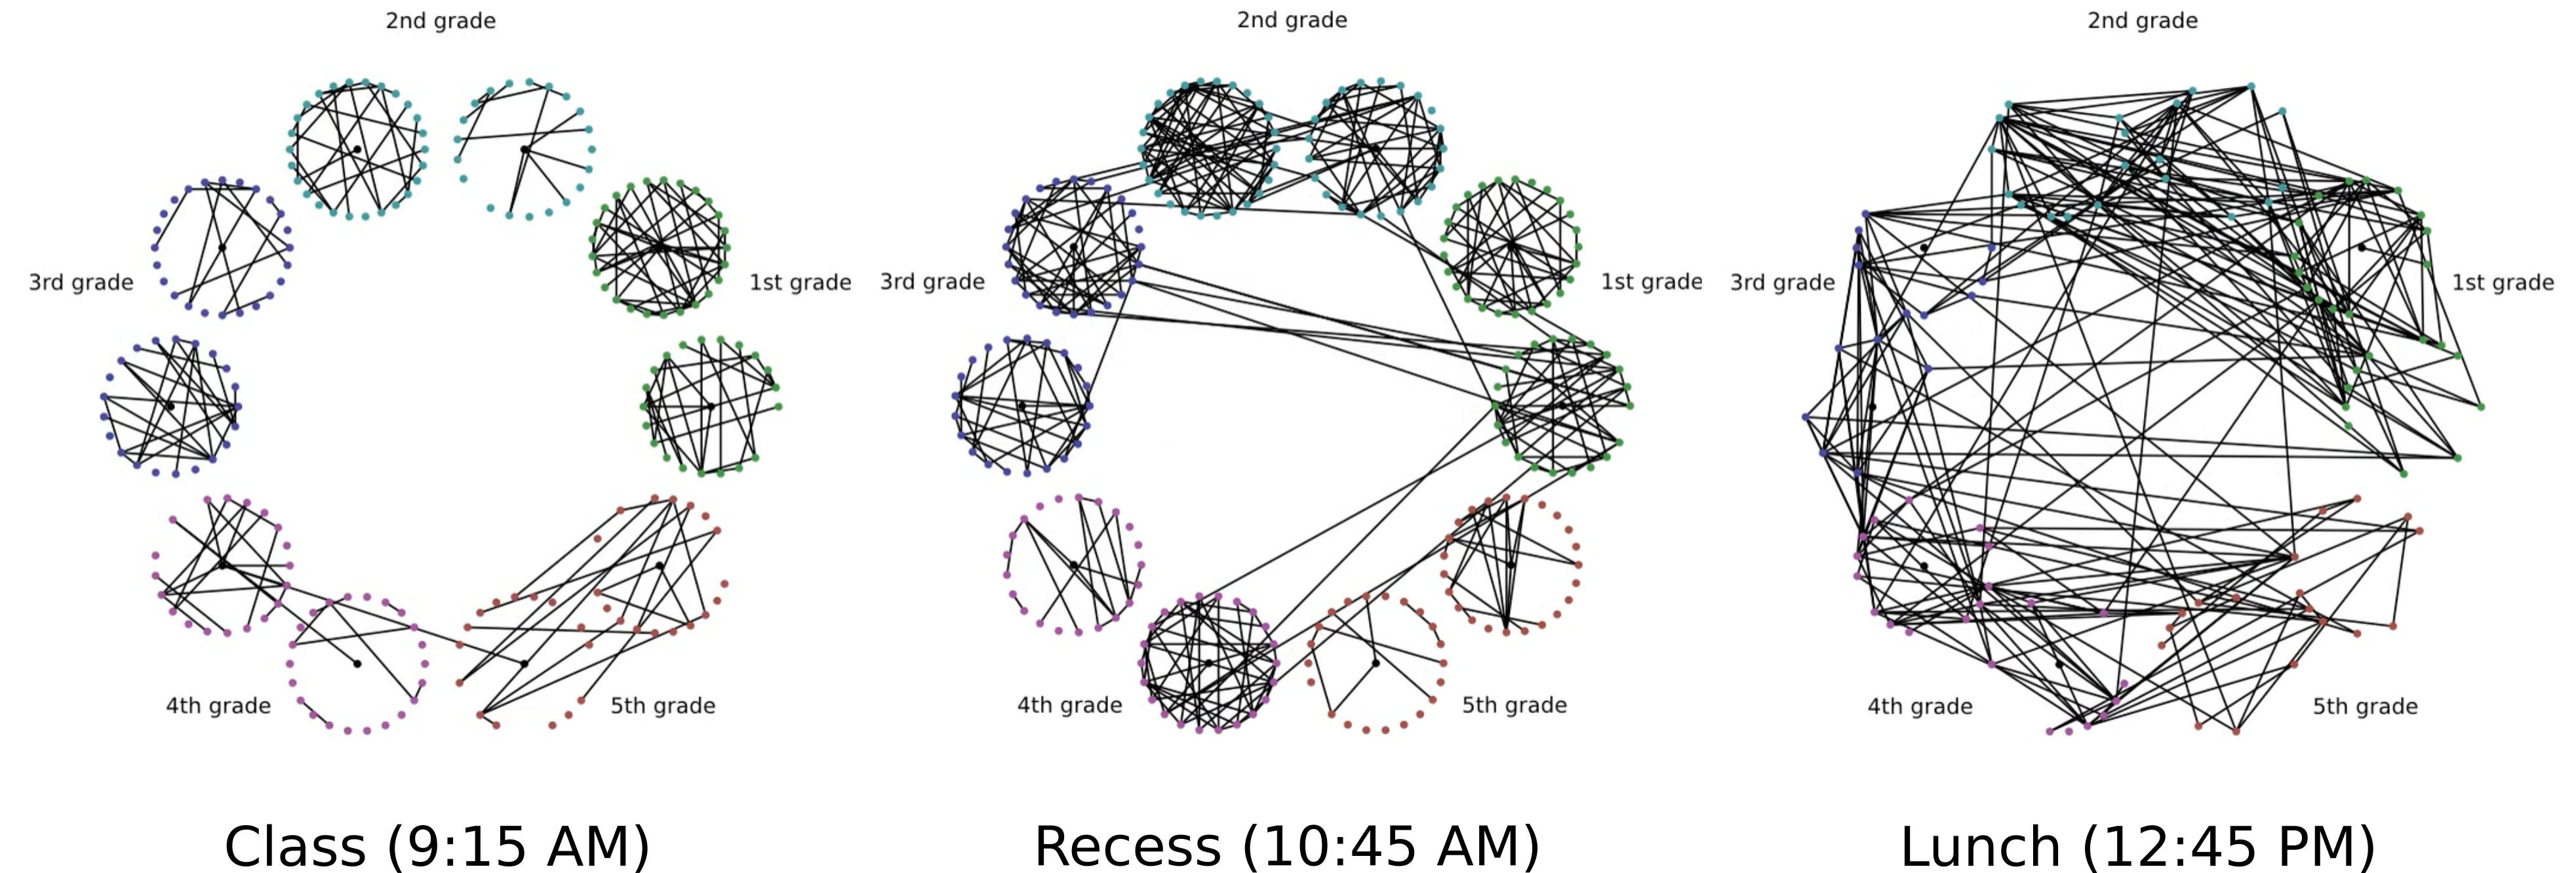
As we can see below, the graph changes significantly over time. There are three distinct phases. In class, the students mostly remain in clusters (the circles represent individual classrooms). During recess, the class groups hold together somewhat, but there is much contact between the classes. In lunch, the classroom communities almost entirely dissolve, leaving us with a graph that looks almost entirely random.
The Approach
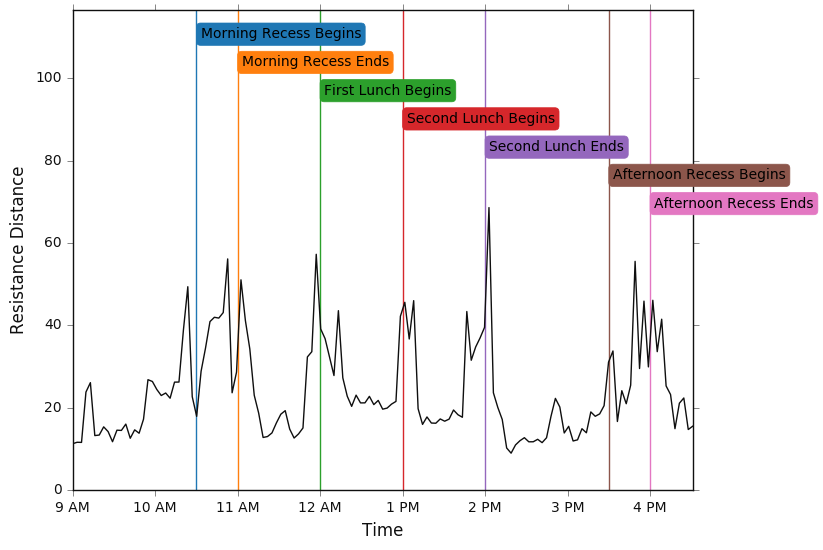
Turns out that a very good way to compare the graphs is to treat each edge as a 1\(\Omega\) resistor, and measure the resistance between vertices. Comparison of this resistance structure between graphs then quantifies how similar or dissimilar they are in their overall structure.
The results of this comparison can be seen below. The resistance distance does a remarkably good job of detecting important structural changes in the graph, and signals the structural transitions between class, lunch and recess.
More Analysis
If you’re hungry for more theoretical analysis of the resistance distance, see my paper on the arXiv.